
Methods
|
Elk capture methods for all studies include a combination of alfalfa baited corral traps (Picture 4) and netguns deployed from a helicopter. Study 1 elk capture was broken into two datasets, 1986-87 and 1991-93, hereafter referred to as study 1a and study 1b. A mixture of cow and bull elk were captured in study 1a, with bull elk excluded from this analysis as population dynamics differ between the sexes with bulls exhibiting greater migratory variation (Gaillard et al. 1998). Study 1a capture occurred in summer and winter, with summer captures excluded from this analysis as they are biased towards non-migratory individuals. After exclusions were applied, individuals remaining for this analysis include: study 1 (ntotal=54, na=8, nb=37, na+b=9), study 2 (n=36), and study 3 (n=12) (Table 1). |

Picture 4. Elk released from corral trap in 2007 (Phillips and Szkorupa 2011).
|
|
Telemetry data was collected by VHF (Very High Frequency) radio collars on all study 1 animals and with GPS (Global Positioning System) collars on study 2 and study 3 animals (Table 1). VHF locations were taken to the nearest 100m using a fix-wing aircraft either weekly for low elevation elk and biweekly for high elevation elk. GPS collar locations were taken to the nearest m and set to 9hr intervals (study 2) or 23hr intervals (study 3) (Table 1). In order to visualize variation in elevation on winter and summer range, elk locations from January, when elk are concentrated on low elevation winter range, and July and August, when elk vary in elevation with multiple summer ranges, were plotted on maps with a digital elevation model (DEM) geographic information system (GIS) layer (Figure 1).
|
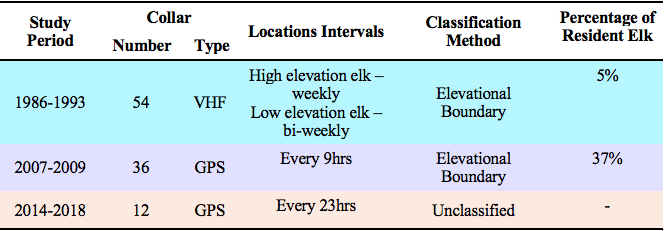
Table 1. Breakdown of three East Kootenay elk telemetry studies. Information includes study period, number of collars and type, intervals elk locations were recorded, method used to classify elk as migrants or residents, and percentage of resident elk found in previous studies (Jalkotzy 1994; Phillips and Szkorupa 2011).
|
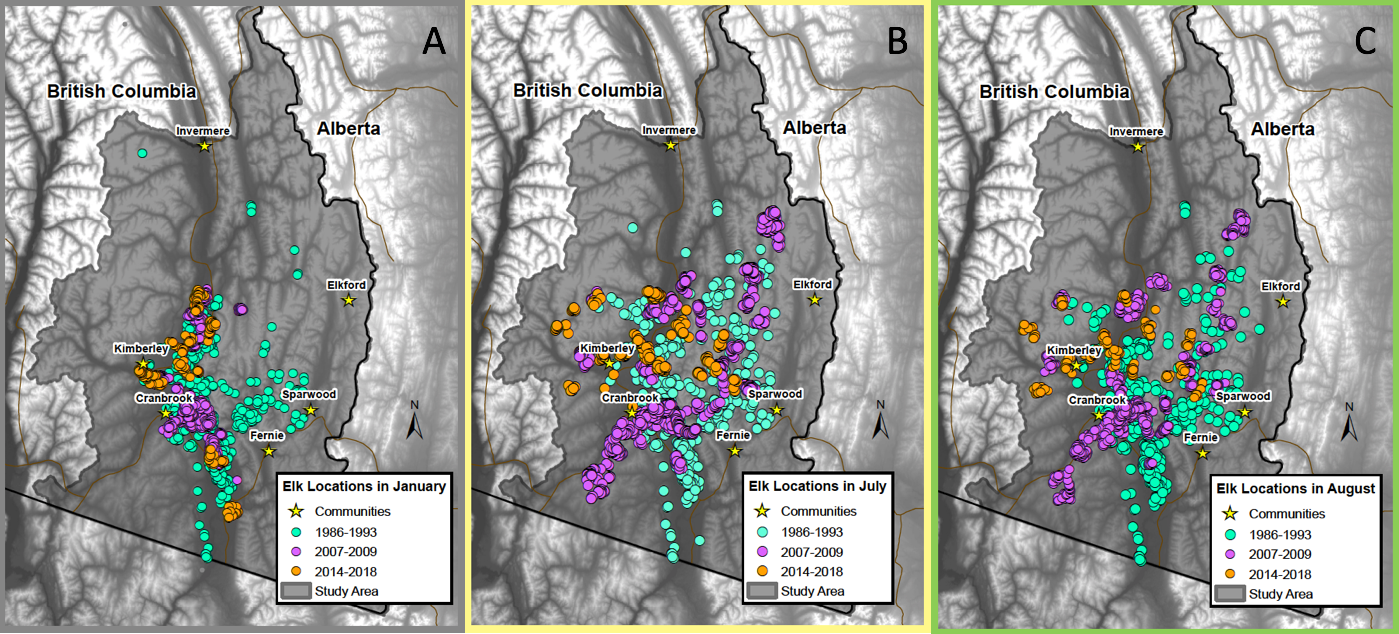
Figure 1. East Kootenay collared elk locations in January (A), July (B), and August (C) for three study periods: 1986-1993, 2007-2009, and 2014-2018.
