
Data
|
Although elevation was captured in all GPS fixes, it was rarely recorded for VHF locations. In order to apply a consistent method, elevations captured from GPS collars were excluded––elevations for all VHF and GPS locations were then extracted from a DEM layer. Data from study 1(a+b) through 3 were compiled together (Table 2), mean elevations per month calculated for each ELK_ID, then plotted for visualization of migratory patterns (Figure 2). After exploring mean elevation of each elk in Figure 2, median elevations for each month of each study period were plotted to visualize migration trends between the study periods (Figure 3). |
Table 1. Simplified data table of elk telemetry locations. Information includes individual study and location identifier (ID), elk identifier (ELK_ID), date and time of location (YY, MM, DD, HR, MIN, SEC), Universal Transverse Mercator (UTM) coordinate system zone (UTM_ZONE), UTM easting (UTM_X) , UTM northing (UTM_Y), elevation in meters of location from Digital Elevation Model (DEM) (ELEVATION), VHF collar type or number of satellites used to capture GPS location (FIX_TYPE), and sex of elk (SEX). 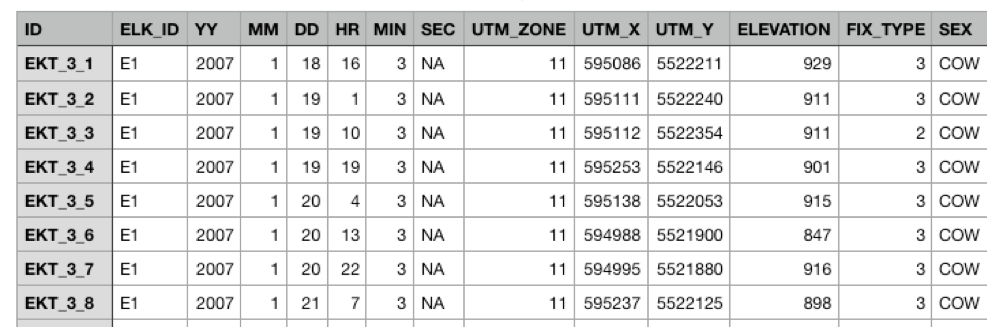
|

|

|
|
Figure 2. Mean elevation per month of individual elk for three study periods: 1986-1993, 2007-2009, and 2014-2018. Elevation determined from VHF or GPS collared elk locations overlaid onto a digital elevation model (DEM) layer.
|
Figure 3. Median of mean elevations per month for each study period.
|
In order to visualize further elevational trends across study periods as well as applicability of the 1100m elevational boundary to classify migrant and resident elk, density plots of mean elevations of elk for each study were plotted for January (Figure 4A), July (Figure 4B), and August (Figure 4C).

Figure 4. Density plots of mean elevations of elk in each study for the month of January (A), July (B), and August (C), with 1100m elevational boundary.
Residual plots and histograms of mean elk elevations for July and August, when elk are on their summer range, were plotted to check for assumptions of normality and homogeneity of variances (Figure 5A-D).
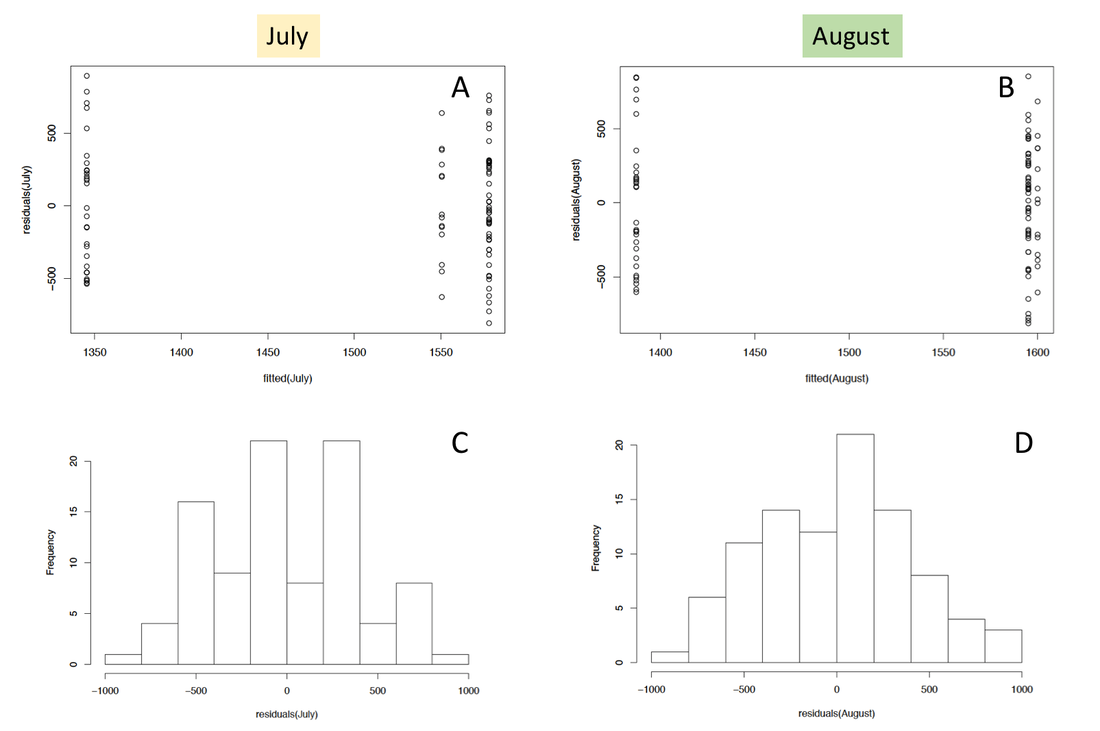
Figure 5. Residual plots (A+B) and histograms (C+D), of mean elk elevations for July and August.
